

THE AMERICAN EXPANSION GALA?
Are we in the early stages of a 1990’s style global expansion? At a minimum, the performance of US stocks tells us that the American Dream is alive and well. Bullish sentiment is expanding beyond the magnificent seven. There is traction in small cap stocks, green shoots in the financial sector (i.e., a mildly inverted yield curve, a solid IPO calendar) and relative stability in residential real estate.
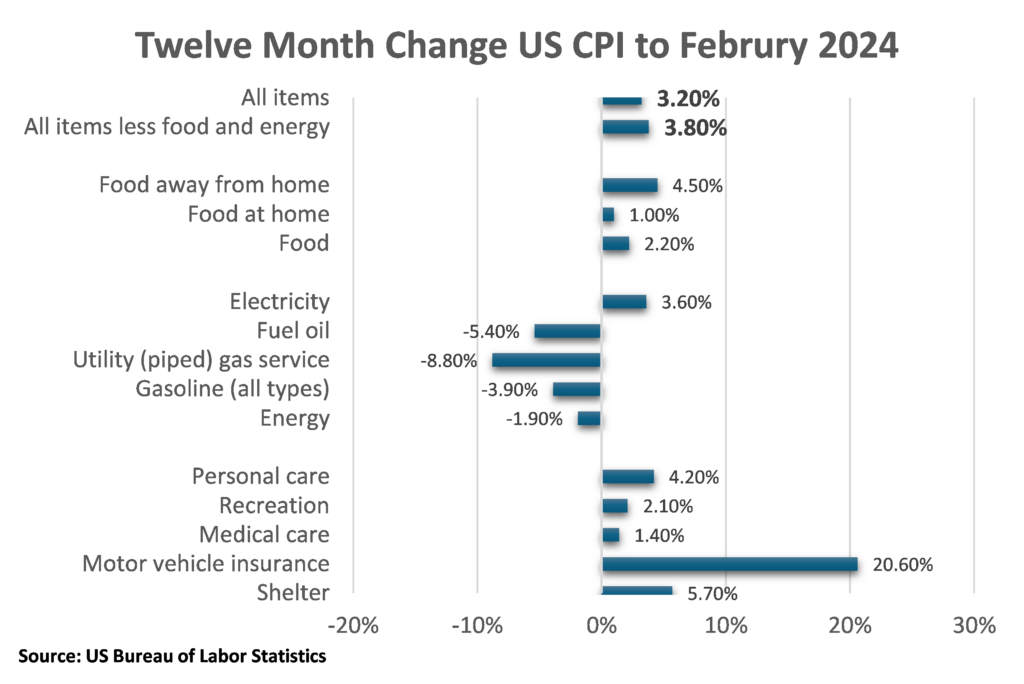
Inflation is trending in the right direction, although the last mile in the fight remains an uphill battle. Canada’s headline CPI, released in February, cooled to 2.8% some 30 basis points below consensus estimates. However, US February headline CPI came in at a slightly elevated 3.2%. Take out food and energy, typically the more volatile components, and the 12-month change in CPI came in at 3.8% (see chart).
The US February data, while disconcerting, was not enough to move the needle at the March meeting of the Federal (FED) Reserve’s Open Market Committee (FOMC). The FOMC’s statement released on Wednesday March 20th, embodied the positive but cautious theme.
According to the FOMC statement, “Recent indicators suggest that economic activity expanded at a strong pace in the third quarter. Job gains have moderated since earlier in the year but remain strong, and the unemployment rate has remained low. Inflation remains elevated.”
“The U.S. banking system is sound and resilient. Tighter financial and credit conditions for households and businesses are likely to weigh on economic activity, hiring, and inflation. The extent of these effects remains uncertain. The Committee remains highly attentive to inflation risks.”
The financial markets’ bullish take from the statement came from the following subtle changes when compared to previous commentary. The FOMC noted the following:
- Economic Expansion: The FOMC reiterated that economic activity has been expanding at a solid pace. This reaffirmation provided stability and confidence to investors.
- Employment Picture: The statement emphasized that job gains remain strong, which is a positive sign for the economy. A robust job market contributes to consumer spending and overall growth.
- Inflation Assessment: The Committee acknowledged that inflation has eased over the past year but remains elevated. This recognition suggests that the FOMC is closely monitoring inflation trends.
Along with the decision to hold rates steady (same position taken by the Bank of Canada), was the implication that FED officials may institute three quarter-percentage point cuts by the end of 2024. That would be the first cut in rates since the Covid pandemic of March 2020.
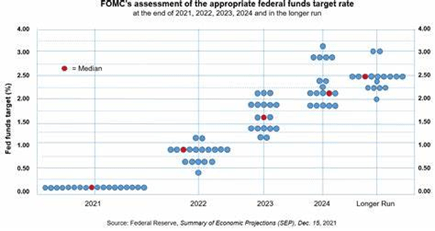
The view that three rate cuts in 2024 came from the FED’s so-called dot plot[1], a closely watched matrix of anonymous projections from the 19 officials who comprise the FOMC. The chart provides no indication about timing, but futures markets were pricing a 75% probability of a rate cut at the June 11-12 meeting.
Our take from the market’s reaction is that rate cuts are not necessary to support the bull case for stocks. The real driver is that rate hikes are off the table.
Chair Powell added fuel to the rate cut thesis when he stated at the press conference following the meeting that he expects some easing in rates if the data cooperates. Noted Powell, “we believe that our policy rate is likely at its peak for this cycle, and that if the economy evolves broadly as expected, it will likely be appropriate to begin dialing back policy restraint at some point this year [although], we are prepared to maintain the current target range for the federal funds rate for longer if appropriate.”
The dot-plot indicates three cuts in 2025 – one fewer than the last time the grid was updated in December. The committee sees three more reductions in 2026 and then two more in the future until the fed funds rate settles in around 2.6%, near what policymakers estimate to be the “neutral rate” that is neither stimulative nor restrictive.
The dot-plot grid is part of the Fed’s Summary of Economic Projections, which also provides estimates for gross domestic product, inflation, and unemployment.
The dot assortment skewed somewhat hawkish from December in terms of deviations from the median, but not enough to change this year’s projections.
Financial markets surged following the release of the FOMC decision. The Dow Jones Industrial Average finished Wednesday’s (March 20) session up 401 points, or just over 1%. Treasury yields headed mostly lower, with the benchmark 10-year note most recently at 4.28%, falling 0.01 percentage point.
Our view from this no news is good news press conference is that financial markets have more room to run. Without any unforeseen shock to the system, investors are comfortable with the notion that the Fed is not going to stand in the way of the bull market.
THE CIRCULAR NATURE OF MEASURING INFLATION
Getting inflation to settle back from the lofty levels experienced in early 2023 has been challenging. More to the point, the ten rate hikes over that time frame has put significant financial pressure on individuals with higher food prices and shelter costs. Both of which have increased by double-digits since 2021.
The February CPI reading – notably in Canada – shows that the hawkish stance by central banks has paid off. Canadian twelve-month CPI coming in below consensus acknowledged that the hawkish tone permeating through the Bank of Canada (BOC) Governing Council was worth the effort. But one has to question why it had to be so painful?
Ironically the BOC’s rate hiking campaign contributes to one of the major components of the CPI basket. We are talking about the 28.3% weight of shelter costs which have skyrocketed because of higher mortgage costs and by extension rents. It’s the classic Catch-22 which we have discussed in previous commentary. As the central bank hikes the cost of borrowing, mortgage holders pay more in interest, especially those who are renewing their terms in a much higher rate environment. That gets factored into CPI and pushes up the headline number, therefore supporting the widely cited rationale of “keeping rates higher for longer.”
The impact of shelter inflation is significant, rising 6.5% annually. Mortgage interest costs, specifically, make up 26.3%, marking the fastest-growing portion over a twelve-month period. It is a classic cause and effect relationship where shelter costs are skewing the big picture.
Taking it out of the equation would peg year-over-year inflation at a mere 1.3% – well below the Bank of Canada’s 2-per-cent target. In fact, doing so would mean inflation has come in lower than 2% since October 2023! Given that other major contributors to the CPI are also decelerating, Canada’s economy is in better shape, inflation-wise, than we’ve been led to believe.
It begs the question why the Bank of Canada insists on including shelter inflation in its deliberations? Interestingly, the inclusion of mortgage interest costs in the CPI is a rarity among central banks, and a practice the Bank of Canada only began in 2016 when it overhauled its method for monitoring inflation growth. It pivoted from using the CPIX – a measure that removes the top eight most volatile contributors to inflation, including mortgage interest costs – in favor of the three it uses today: the CPI common, trimmed mean and median.
The BOC felt these new core measures would better track long-term changes in inflation, be less volatile overall and better relate to the underlying drivers of price increases. However, as Toronto-Dominion Bank senior economist James Orlando recently argued in a paper titled The BoC’s Shelter Inflation Problem, a stagnant economy, combined with the massive fluctuations seen in housing markets since the COVID-19 pandemic took hold, mean the “outsized impact of shelter costs is keeping measures of underlying inflation higher in Canada than in other major economies.”
“[Given] that the economy has flatlined since last spring, the BoC’s preferred core metrics have become less connected with the economic cycle due to the influence of structural factors related to housing,” Mr. Orlando writes. “And the fact that one sector is driving this disconnect means that the current inflation metrics aren’t doing a good enough job at guiding monetary policy for the broad economy.”
He points out that no matter how aggressively our central bank acts on interest rates, it simply does not control the demand forces behind the housing market, adding “the longer the BOC continues to look at inflation through its current lens, the longer Canadians will have to bear the weight of a heavily restrictive policy rate.”
One can argue – which we have in the past – the Bank of Canada’s current inflation gauge doesn’t accurately capture – or counter – the phenomenon of Canada’s overheated housing market. While overly accommodative interest rates certainly pose a risk of too-quick price increases, other factors such as rapid population growth and a lack of missing middle and affordable rental housing are also largely to blame. These catalysts are outside the influence of monetary policy.
The silver lining is that future rate cuts will have a circular effect on the CPI. As mortgage rates decline it will lower shelter costs at renewal time. That is as long as residential housing prices do not rise proportionately. It’s a fine line!
POLITICAL POLARITY
As the US elections draw closer, one thing is clear: President Joe Biden has a popularity problem. His approval rating is stubbornly low, he’s behind former president Donald Trump in the polls and the likelihood of him losing his bid for re-election this fall is high. What’s surprising is that this is all happening at a time when the US economy enjoys low unemployment and rising wages. Makes one wonder why?
The problem is that a large part of the electorate has become estranged from Mr. Biden’s Democratic Party. When Democrats talk, they tune out. Mr. Trump, in contrast, broadcasts on their frequency.
For some thoughts on this we turn to a 2002 book by Ruy Teixeira and John Judis entitled The Emerging Democratic Majority. The influential book predicted that Democrats were on the cusp of electoral dominance. A key driver would be the rapid growth of the U.S.’s non-white population, which leaned Democratic. If the party held on to its traditional voters, and added a significant minority to its ranks, the Republican Party would be swamped.
That future appeared to have arrived in 2008, with the election of Barack Obama to the White House. And then, the emerging Democratic majority failed to emerge.
Last year, Mr. Teixeira and Mr. Judis published a follow up book entitled Where Have All The Democrats Gone? The objective was to explain why their earlier predictions didn’t pan out, and what Democrats can do to get back on track.
The problem for Democrats is that they’ve lost what was once their base: the white working class. Many believe that it turned in 2016 when Hillary Clinton alleged that Trump voters were a “basket of deplorables.” The takeaway was that if Mr. Trump wins in 2016, it’s because he’s racist. If Democrats lose, it’s because they refuse to be.
While that explanation resonated with many Democrats, Mr. Teixeira and Mr. Judis were not swayed. They believe the Democrats lost a fair number of white voters that backed Mr. Obama in 2008. What’s more, Democrats are also losing the non-white working class. According to the most recent New York Times/Siena poll, if an election were held today, Mr. Trump would win the Hispanic vote.
When you consider the Democrats who ran for the party’s nomination in 2020, Mr. Biden was probably the only one who could have won enough swing voters in key swing states – blue-collar places such as Michigan and Wisconsin – to beat Mr. Trump. He is old enough to have spent decades in the earlier version of the party, and he clearly sees himself as the president of blue-collar America.
The challenge is that he leads a coalition of groups whose biggest and loudest voice is that of educated progressive voters (who are also, incidentally, mostly white). And their beliefs and interests are not aligned with blue collar voters.
Consider Mr. Biden’s Inflation Reduction Act (IRA). It’s hundreds of billions of dollars aimed at subsidizing manufacturing industries into locating in the US. The reindustrialization goal could have come from Team Trump. But in the case of the Biden plan, industrial policy and protectionism are tied to fighting climate change.
For educated progressive voters, the fact that the loudest note is about climate change makes it sound right. But for a lot of blue-collar voters, the IRA is confusing and off key. It sounds like the Biden administration is saying, “Make America Great So It Can Be Green.” Which is not as easy to get behind as Mr. Trump’s false, but more straightforward, slogan.
On a host of issues, cultural and economic, the view from Brooklyn or Berkeley is not what most Americans see. A recent Harvard CAPS/Harris poll found that, among a long list of public institutions, companies, organizations, and foreign entities, the one with the highest approval rating is the US military, with a net rating of plus-70 per cent. Next in line: the police.
The issue that currently threatens to hand the election to Mr. Trump is immigration. There were a record 2.5 million “irregular migrant encounters” at the U.S.-Mexico border last year. Most who crossed wanted to be stopped, so they could make an asylum claim. Most were immediately released into the US, pending adjudication of their claim, which will take years.
The progressive wing of Mr. Biden’s party has no problem with that, but most Americans do, including a host of Democratic mayors and members of Congress in swing districts. Fox News ginned up the story, but in this case, there is something to gin up.
In a recent ABC News/Ipsos poll, Mr. Biden’s point of greatest unpopularity is immigration. The Harvard CAPS/Harris poll found that Americans think the issue is the most important one facing the country – and Mr. Biden’s biggest failure.
So earlier this year, Mr. Biden tried to act. He promised that if Republicans in Congress passed a tough border bill, he’d sign it. It almost worked – until Mr. Trump ordered his minions to block any such legislation until after the election.
Mr. Trump doesn’t have real answers for what’s bugging blue-collar America. But give the great huckster this much: He’s been far better than Democrats, or old-school Republicans, at identifying working-class worries, and preying on them.
RISING OUTLOOK FOR S&P 500 EARNINGS
Bank of America Global Research recently raised its earnings forecast for the S&P 500. The analysts are currently projecting a 12% increase in profit for the companies in the benchmark index this year, raising the per share profit estimates from US $235 to US $250.
Bank of America notes that “2023 was a transition year for Corporate America, and companies have now adjusted to the new higher rate and tepid demand environment.”
The brokerage expects technology giants such as Microsoft, Amazon, Alphabet, and META to spend US $180 billion on capital expenditure this year, potentially benefiting from a “virtuous cycle” stemming from investments in artificial intelligence (AI).
“Semis and networking are the most obvious beneficiaries, but increased power usage and the physical build-out of data centers will lead to more demand for electrification, utilities, commodities, etc.,” noted Bank of America analysts Ohsung Kwon and Savita Subramanian.
As big tech enters an investment cycle and traditional companies cut costs, the growth differential should merge between tech companies and the rest of the market. The so-called transition to a broadening of the growth prospects across the economic landscape.
The brokerage noted that demand recovery will be the key driver of earnings through 2025 and efficiencies should lead to further margin expansion. Earlier in March, Bank of America raised its 2024 S&P 500 target to 5,400 points, joining other major brokerages in predicting the index would end 2024 in a range of 5,200 to 5,400.
Given the current momentum, we suspect that US brokerages will again increase their projections especially if the FED cuts rates as expected.
[1] According to the Chartered Financial Institute the FED’s dot plot The FOMC dot plot summarizes the FOMC’s outlook for the federal funds rate. It provides an anonymous view of the sitting members as to where they see rate cuts taking place. It was introduced in 2012 as an effort by the Federal Reserve to be more transparent regarding its policies. Investors and economists commonly compare the most recent FOMC dot plot to previous FOMC dot plots to obtain an indication of the direction (hawkish or dovish) of monetary policy.