

If 2023 taught us anything it was that central bankers, despite their many foibles, can occasionally challenge the status quo and defy expectations. Given a series of unprecedented rate hikes, most economists believed that a hard landing was inevitable, and a recession would bear down on the global economy sometime in 2023 or early 2024. So much for consensus!
Rather than plummeting into a recession, the US economy was propelled by a motivated consumer supported by a robust labor market and massive fiscal stimulus. Not only did the US economy defy recession forecasts in 2023 it now appears to be on a glide path towards the illusive soft landing.
What surprised most US economists despite the aggressive rate hiking campaign and quantitative tightening by the US Federal Reserve (Fed), was stronger than expected year over year GDP growth (see chart).
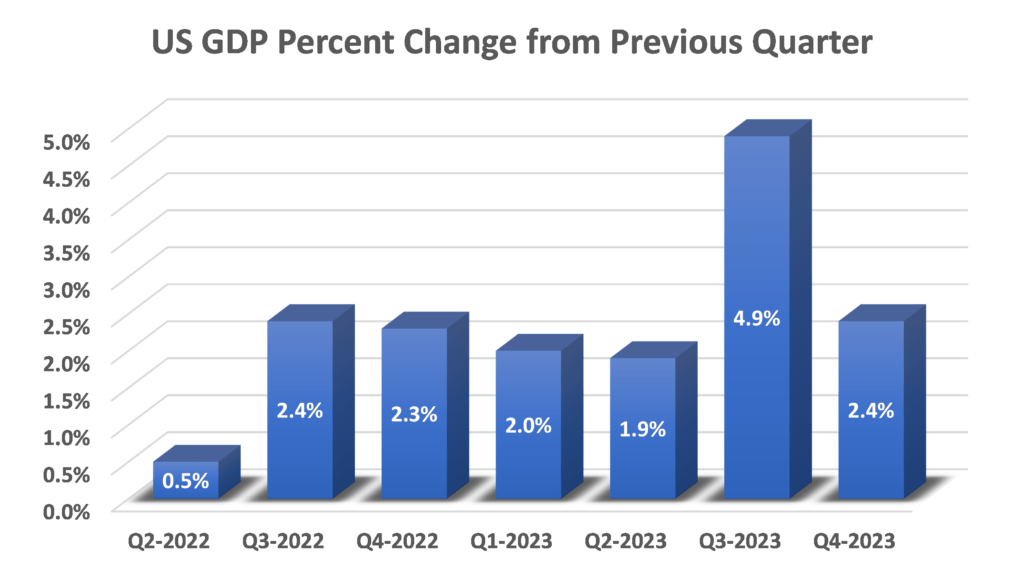
Stronger than expected growth in 2022 fell into the good news is bad news camp. Investors believed that if the above trend growth persisted into 2023, it would create an inflationary spike that would cause the Fed to be even more aggressive. Instead, through the first half of 2023 US growth stabilized – not too hot not too cold – which allowed the Fed to conclude their rate hiking cycle at the end of the summer. The US economy shifted into high gear causing a spike in third quarter GDP.
That too was a surprise. While most economists were forecasting a reacceleration of the economy at some point in 2023, most expected it to occur when inflation was high. As it turned out, the reacceleration occurred when inflation was on a downward trajectory.
According to the forecasting model (last updated on January 10, 2024) used by the Atlanta Fed, the estimated growth rate of real gross domestic product in the fourth quarter of 2023 is 2.4 percent. The combination of above trend growth and lower than expected inflation has allowed the Fed to remain on the sidelines. As tight monetary policy subsided, investor sentiment shifted, and stocks rallied during the fourth quarter of 2023.
Much of what occurred in 2023 had to do with timing. At the end of the summer, it became clear that above-trend GDP growth was not preventing a re-balance within the labor market. Which is to say, outsized wage demands were being offset by an increase in productivity which reduced the risk of a wage price spiral.
There is also evidence that the number of available workers has moved closer to equilibrium which means the transitory influences on wages and prices have faded or reversed. Surprisingly, demand for labor has been contained despite an acceleration in the final demand for goods and services. On the surface this seems counter intuitive but is grounded in the logic underpinning the non-linearity of the Beveridge Curve.
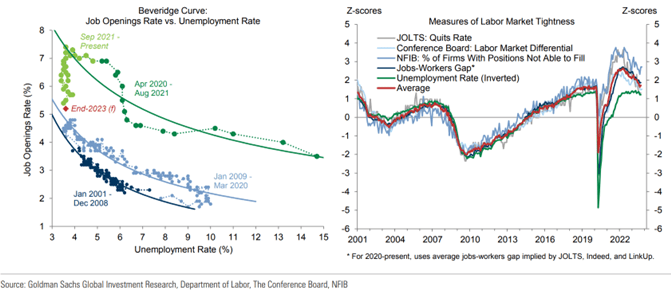
According to Wikipedia, the Beveridge curve is a graphical representation of the relationship between unemployment and the job vacancy rate. Stated another way, it charts the number of unfilled jobs expressed as a proportion of the labor force. It typically has vacancies on the vertical axis and unemployment on the horizontal.
The curve, named after William Beveridge, is hyperbolic-shaped and slopes downward, as a higher rate of unemployment normally occurs with a lower rate of vacancies. If it moves outward over time, a given level of vacancies would be associated with higher and higher levels of unemployment, which would imply decreasing efficiency in the labor market. Inefficient labor markets are created by mismatches of available jobs, the unemployed and labor mobility.
The position on the curve can indicate the current state of the economy. For example, recessionary periods are indicated by high unemployment and low vacancies, corresponding to a position on the lower side of the 45° line, and high vacancies and low unemployment indicate the expansionary periods on the upper side of the 45° line.
In the United States, following the Great Recession, there was a marked shift in the Beveridge curve. A 2012 International Monetary Fund (IMF) report said the shift can be explained in part by “extended unemployment insurance benefits” and “skill mismatch.”
Think of the Beveridge Curve as a graphic representation of a feedback loop where, notes Goldman Sachs, workers quitting causing employers to preemptively post more job openings. That trend can heat up quickly but can also cool down quickly.
As the labor market and inflation expectations normalize, the drive to demand outsized wage gains to offset inflationary spikes has moderated. That change in psychology coupled with better-than-expected productivity gains, has reduced the likelihood of a wage price spiral. Bottom line, we anticipate a continued downward trajectory for inflation, and about a 20% probability (well below the historical average of 48%) of a major recession in 2024.
MARKET OUTLOOK
We are mindful that blindly following headlines is fraught with danger as witnessed by the recession fears that permeated investor’s psyche at the beginning of 2023. By 2023 year end, it was clear that equity markets and industrialized economies were surprisingly resilient and investor pessimism was replaced with unbridled optimism. The takeaway from 2023 is that financial markets continue to surprise us.
As we enter 2024, investors are optimistic that recession fears were overdone. That’s a good thing, but side stepping a recession will not be enough to propel equity markets to new highs. For equity market to experience robust returns in 2024, it will require some combination of four tenets: above-trend GDP growth, indications that inflation is returning to target, a more dovish or less hawkish Fed that could lead to rate cuts, and earnings momentum.
Within those four basic tenets, investors must be cognizant of the uncertainties that must be factored into any bullish thesis. For example, more than half of the world’s population will undergo elections in 2024 and the results could have a profound impact on global growth.
There are geopolitical tensions that could cause current upheavals to magnify. The expansion of the Israeli / Palestinian conflict is a distinct possibility, a revitalized Russia could have dark consequences for the Ukrainian war which in a worst case, could expand to a NATO conflict. These are unknowns that cannot be forecast but must be considered from the risk side of the equation. Risk reduction through diversification is key. Fortunately, the upside of higher rates is that bonds have become a useful tool to dampen portfolio variability. With that in mind, let’s build on the bullish tenets and weigh in on the uncertainties that could unravel economic fortunes.
Political Uncertainty
We expect politics to dominate the headlines in 2024. Election rhetoric, notably in the US, is a potential disruptor. Whether citizens buy into Trump’s “dictator for a day” mantra or the chasm between Republicans and Democrats on border safety, will determine the outcome of the US elections.
Fortunately, assuming a holding period of at least eight years (i.e., two presidential election cycles) political outcomes have a minimal impact on portfolio performance. According to Capital Group Research, “historically the party that prevails has had little impact on long-term market returns. Since 1936, the 10-year annualized return of U.S. stocks (as measured by the S&P 500 Index) made at the start of an election year was 11.2% when a Democrat won and 10.5% in years a Republican prevailed.”
We already have the results from the Taiwan election which provided the electorate with three choices. Taiwan’s President Tsai Ing-wen secured a third term after sweeping to victory in an election dominated by the island’s relationship with China. Ms. Tsai secured just over 40% of the popular vote. That 60% of the popular vote went against the incumbent suggests that the Taiwanese population are generally satisfied with the status quo, a position that President Tsai has reinforced in discussions with allies. That may be enough to quell an aggressive Chinese response although that view is tenuous at best.
The China Card
There is little doubt that China is facing some serious challenges. Cracks in the real estate sector has morphed into chasms which threaten the entire Chinese economy. Unemployment rates are rising particularly among the younger generation that is still subject to the fallout from the failed one-child policy implemented in 1980 and continued through to the turn of the century. Today, China’s population is in decline as many families are deciding not to have children.
From an investment perspective, China has become the epicenter for fake news. Data provided by the Central committee on the country’s growth, unemployment and inflation are simply not credible. More recently, China has cut off the data links that provide the numbers used to publish the economic datasets. Which is to say, there is no way to confirm the data that is only released when approved by the communist party’s central committee.
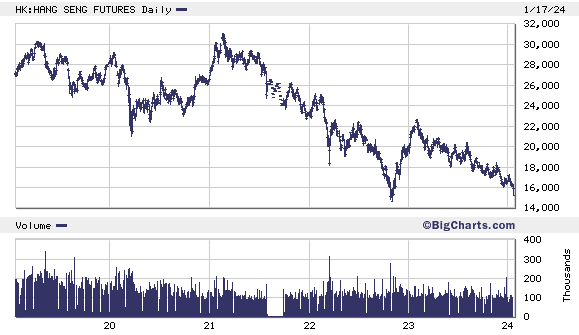
The best evidence that friction caused by central planning is a counterweight to the invisible hand of capitalism can be found in the collapse of Hong Kong as the Asia Pacific financial hub. Hong Kong’s Hang Seng Index (HSI) validates the downfall as investors have lost half their capital over the preceding five years, and there does not appear to be any evidence that things are about to change. So far in 2024, the HSI is down double digits.
There is simply no compelling narrative that suggests China is a viable investment option. To that point investors need to be mindful of index based international ETFs that have a sizeable weighting in China. In our view, global exposure is best served with international X-China ETFs.
Cash Is Not King
At the beginning of 2023, investors were risk averse and held an inordinate amount of capital in cash and cash-equivalent instruments. That’s not surprising as high uncertainty leads investors to seek the reassurance that comes from a guaranteed return that was close to 5%. But that is only one side of the coin as opportunity cost weighs on potential growth.
That point was driven home when markets rallied in the fourth quarter of 2023. Whether that will be enough to coax some of the US $8.8 trillion currently in money market funds remains to be seen. Such a sizeable allocation in cash equivalent assets has caused some bulls to be optimistic about 2024.
On the surface, that position seems reasonable, although one must be mindful of context when looking at datapoints. While US $8.8 trillion is a record allocation in risk-free assets, it is still less than 20% of the US $45 trillion market cap of the entire US equity market. It is also notable that, on a percentage basis, the current allotment to risk-free assets is less than the allocation in 2015 and there is no guarantee that these money market funds are sitting on the sidelines looking for an opportune time to be deployed. In many cases, investors hold risk-free assets to have a buffer for unexpected expenses.
Still, if the fourth quarter 2023 rally carries through in the first quarter of 2024, equity markets will get an additional boost from the FOMO (i.e. Fear of Missing Out) trade. Investors who are still on the sidelines could be missing out on future opportunities and putting their long-term goals at risk. Especially if, as some believe, we are on the cusp of a major transition that will cause investors to seek attractive investment opportunities in stocks and bonds.
The Next Phase of Artificial Intelligence
Breakthroughs in artificial intelligence (AI) have captivated the world and sent share prices soaring for a handful of mega-cap tech companies. Some of these leading-edge firms will likely continue to be at the forefront of innovation as AI applications roll out across the economy, impacting the way we live and work. Nvidia and Advanced Micro Devices, for example, designs powerful computer chips needed to run AI applications, and Microsoft co-owns the popular AI app ChatGPT. But their recent successes have resulted in a U.S. stock market that’s more concentrated than it was in the dot-com era.
As of December 2023, the ten largest companies in the S&P 500 accounted for 30.9% of the market capitalization compared with a 26.6% weighting for the same mega-cap darlings in March 2000. The question is whether the so-called “magnificent seven” stocks can maintain their dominance?
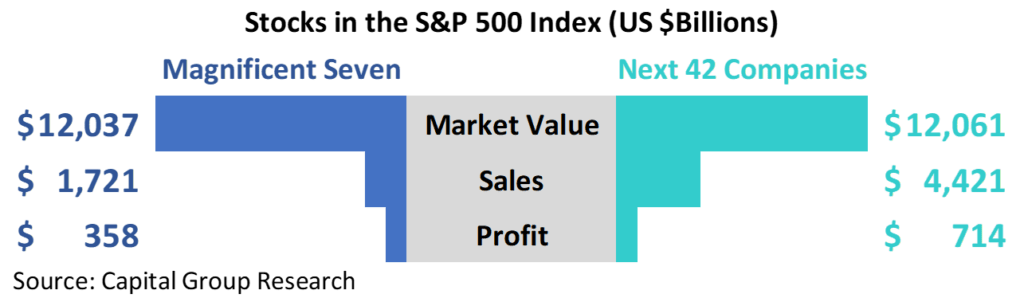
Capital Group Research provided an interesting chart that compares the market capitalization of the Magnificent Seven stocks – Apple, Microsoft, Amazon, Nvidia, Alphabet, Tesla, and Meta – against the next 42 stocks in the S&P 500 index that combined, have an equal market capitalization. This second-tier group includes stalwarts like Berkshire Hathaway, Broadcom, JPMorgan Chase, United Health, and Eli Lilly.
Notes Capital Research, “The graph compares market value, sales, and profit. The market value of the Magnificent Seven is US $12.04 trillion compared to the next 42 companies at US $12.06 trillion. Sales for the Magnificent Seven are about US $1.7 trillion, and the next 42 companies are US $4.4 trillion. For profit, the Magnificent Seven boasts about US $358 billion versus the next 42 companies at US $714 billion.”
What we take from this is that diversification will be a critical consideration in 2024, something that was not obvious in 2023 when a small number of mega cap tech names delivered most of the S&P 500 return. We think optimum diversification will provide some much-needed support, should mean reversion return to the US equity market in 2024.
In our view, the mega-cap tech names will continue to do well in 2024. Especially the companies that will benefit most from the implementation of AI. Names to focus on include Microsoft, Meta, Nvidia and Advanced Micro Devices. One can make the case that the positive fundamentals that propelled the 2023 outperformance of the magnificent seven (107% for the Bloomberg Magnificent 7 Total Return Index versus 24% for the S&P 500 Index) will continue albeit at a more tepid pace. We say that because during 2023, many of the mega-cap tech names implemented stronger cost discipline through headcount reductions and capital reallocation to more profitable projects.
Will Bonds Make a Comeback in 2024?
Investment management 101 has always considered bonds a separate asset class within a portfolio. Bonds provided diversification because they were not typically as volatile as stocks and provided some ballast when equity markets were experiencing turbulence.
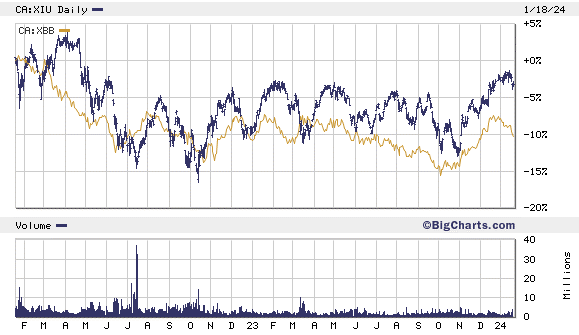
However, as interest rates collapsed during the pandemic, bonds did not provide the diversification one would expect. In 2022 and 2023 as central banks were raising rates to combat inflation, bonds provided no stability as they traded in tandem with stocks See chart below that displays the S&P TSX 60 Index Fund (XIU) with the iShares Canadian Bond Universe ETF( XBB). Such a high degree of correlation between these two asset classes had not occurred since 1977.
Bonds also failed the stability test as the volatility for Canadian fixed income was not much different from what equity investors experienced. That volatility started in 2022 and continued through 2023.
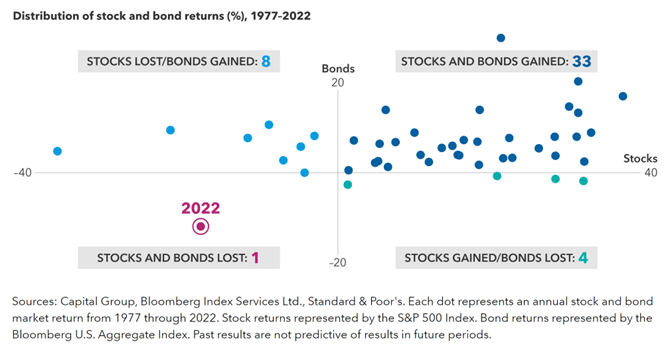
Further evidence can be found in the following fourth-quadrant scattergram. According to Capital Group Research, “Each point represents the annual stock and bond return. It shows 2022 as the only point squarely in the lower left quadrant, indicating a decline for both stocks and bonds in that year. That quadrant is labeled: STOCKS AND BONDS LOST: 1.
The upper left quadrant represents years when stock returns were negative, but bond returns were positive. It contains eight points and includes a label stating: STOCKS LOST/BONDS GAINED: 8. The lower right quadrant represents years when stock returns were positive, but bond returns were negative. It contains four points and a label indicating: STOCKS GAINED/BONDS LOST: 4. The upper right quadrant represents years when stock and bond returns were both positive. It contains 33 points and is labeled: STOCKS AND BONDS GAINED: 33.
The preceding graphs provide interesting signposts. But that was then, and this is now. We believe the picture has brightened considerably in recent months. With inflation falling faster than expected and most central banks indicating they are done raising interest rates, that has triggered a fourth-quarter 2023 rally across bond markets.
Also noteworthy is that the end of a tightening cycle has historically been a good time to own bonds. In our view, as yields have increased across credit sectors and with the possibility of rate cuts in 2023, bonds are more likely to return to their traditional role as a portfolio diversifier. They may also get a sizeable bump if the economy slows resulting in a series of rate cuts.
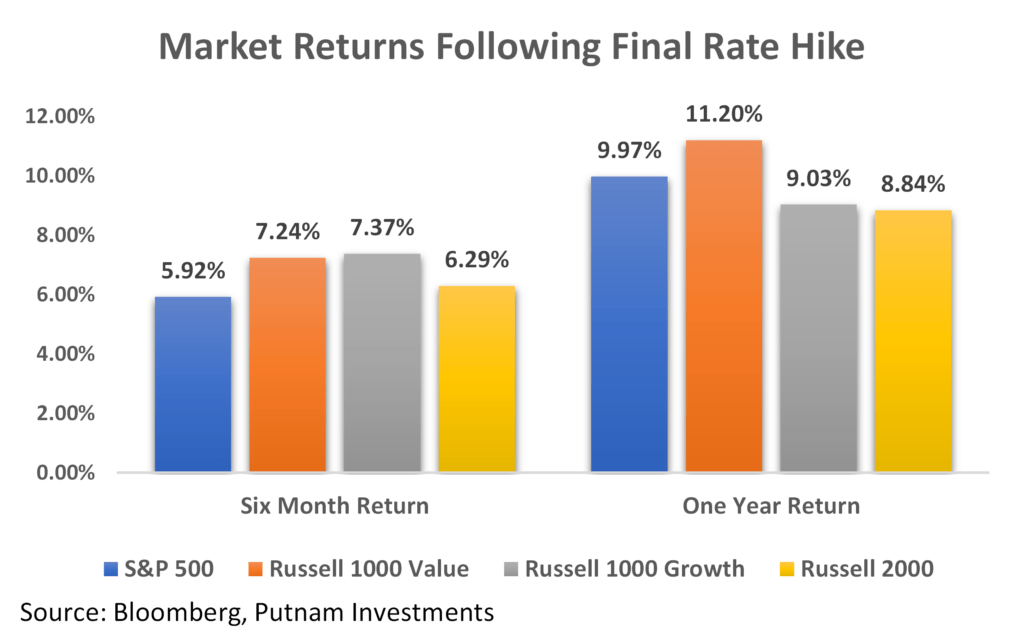
And as reflected this chart, historically, equity markets tend to show resilience with positive returns following the final rate hike by the Federal Reserve, demonstrating a pattern of recovery and growth in the periods analyzed. Despite occasional volatility, the overall trend suggests that markets adapt and can even thrive after such monetary policy adjustments.
In conclusion, the US economy appears to be on a path towards a soft landing, defying initial concerns of a downturn due to rate hikes. This stability, driven by strong consumer spending, a robust labor market, and fiscal stimulus, allowed the Federal Reserve to pause its rate hikes. Investor optimism for 2024 is cautious but positive, with market growth hinging on several factors including geopolitical tensions and economic policies such as a reduction in rates. Diversification remains a key investment strategy, with a renewed focus on bonds as stabilizers in a changing interest rate environment. The impact of AI on markets, challenges in China’s economy, and significant cash reserves are additional factors influencing 2024 market trends. As the global landscape evolves, maintaining a diversified portfolio and monitoring geopolitical risks is essential for navigating the uncertainties ahead.
Richard N Croft

Chief Investment Officer