

Wag The Dog was a 1998 satirical comedy directed by Barry Levinson that starred Dustin Hoffman and Robert DeNiro. It cast a light on the world of political spin by taking viewers on a rollercoaster ride through the back alleys of political manipulation. As we enter the US presidential election cycle, we will witness firsthand the depths to which politicians will go to propagandize the canine chutzpa. But that’s a story for another day.
Discounting the wagging the dog thesis has become the preeminent goal of financial marketing departments intent on maintaining profitable enterprises at the expense of the impact certain products have on equity markets. For inexperienced investors unaware of cause-and-effect relationships, these market disruptors can lead to short-term black swan events.
To dig into this issue, I would like to draw your attention to the following three-day chart of the S&P 500 composite index. Note specifically the sell-off that occurred on December 20th highlighted inside the circle. Those data points illustrate a 58-point end-of-day decline in the index that began at 3:00 pm and lasted for 45 minutes. More disconcerting is that the sell-off was not the result of any specific news.
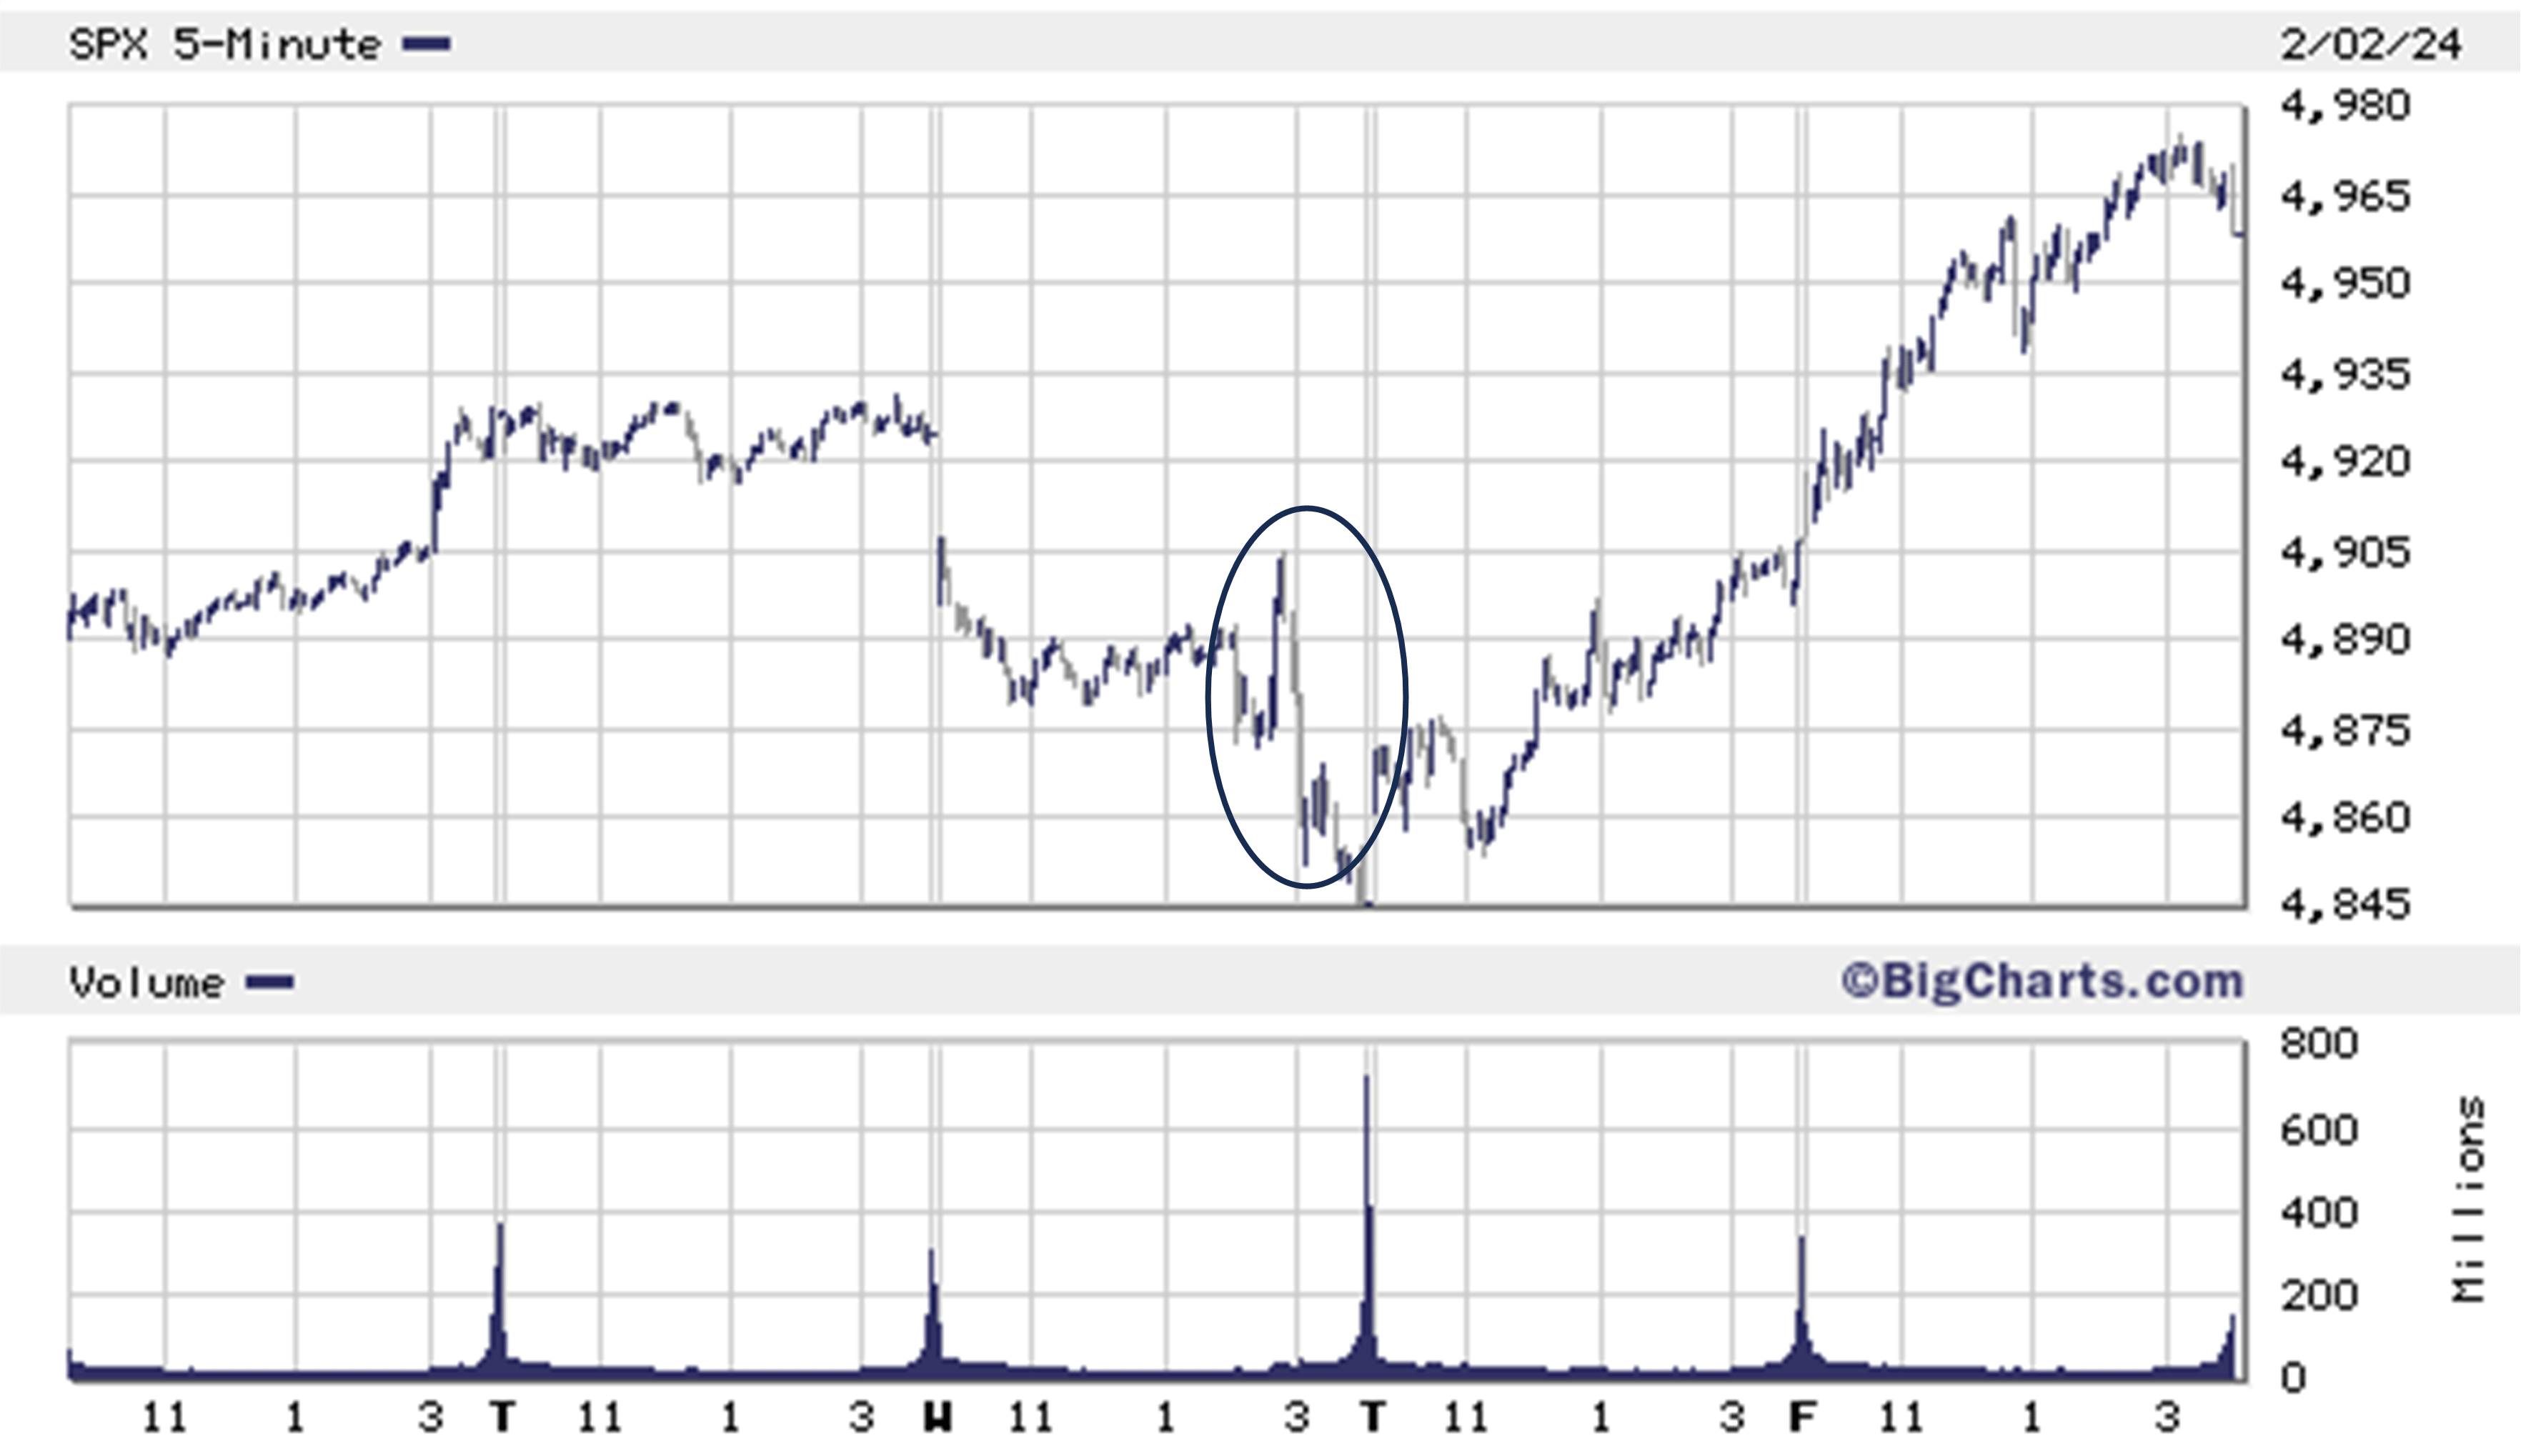
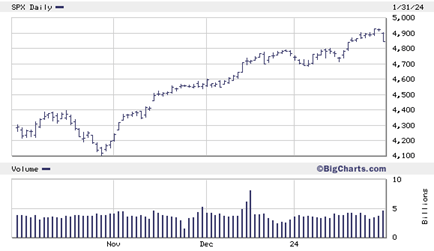
While we will never know with certainty, it appears the sell-off was caused by individual investors selling a sizeable (more than one million contracts) number of Zero Days to Expiration (0DTE) call options. The 0DTE options were set to expire at 4:00 pm. The explanation seems plausible since these investors had been playing the market from the long side with great success. The S&P 500 index had been in rally mode since the third week of October 2023 (see following chart). More evidence supporting this position can be found the next day, as the S&P 500 index reestablished its upward trajectory.
Characteristics of 0DTE Options
Zero Days to Expiration options, commonly known as “weekly options,” represent a unique and high-risk subset of financial derivatives trading. These options contracts have a short lifespan that typically lasts anywhere from one day to one week. Having such a short time to expiration makes these contracts extremely profitable to the exchanges but are highly time-sensitive and speculative. Traders and investors engaging in Zero Days to Expiration options must navigate a volatile landscape where market movements can have an immediate and profound impact on the value of their positions. They are the closest thing to gambling where emotions run the gambit between fear and greed.
Zero Days to Expiration options are characterized by their incredibly short lifespan. Unlike traditional options that may have monthly or quarterly expiration dates, these options expire at the end of the trading day or week. As such, time decay, or theta, of Zero Days to Expiration options is exceptionally high. As the options approach expiration, the rate at which their time value erodes accelerates. Traders need to be acutely aware of the impact of time decay and its potential to erode the value of their positions rapidly.
Zero Days to Expiration options provide a leveraged means for traders to speculate on short-term market movements. The limited time frame encourages traders to take highly directional bets, amplifying both potential profits and losses. Needless to say, this inherent leverage requires a careful and disciplined approach to risk management.
Given their short lifespan, Zero Days to Expiration options are often favored by day traders. These traders aim to capitalize on intraday price movements, exploiting short-term trends and market inefficiencies. Day trading requires quick decision-making, technical analysis skills, and a deep understanding of market dynamics.
Because of outsized holdings of long call options on December 20th any attempt to sell 0DTE positions when the market is tanking would be like trying to push a camel through a pin head. The reverberations impact the cash market because most of the companies on the other side of these trades are professional market makers who immediately offset their risk in the futures market. When a market maker buys the call options, they are forced to sell index futures which causes the cash market to crash. Hence the tail wagging the dog analogy.
The Chicago Board Options Exchange (CBOE) which offers 0DTE options argues that these instruments do not influence market activity because most of the time there is a balance between buyers and sellers. That’s probably a fair assessment, but as December 20th illustrated, there are periods where a massive imbalance occurs. It is during those periods where investors need to be aware of the potential blowback should a significant group of trader’s head for the exit.
Note the warnings from the CBOE: “The fast-paced nature of Zero Days to Expiration options trading can evoke emotional responses, such as fear and greed. Successful traders in this space must maintain emotional discipline, adhere to their trading plans, and resist impulsive decision-making.” Good luck with that.
STEADY AS SHE GOES
First the Bank of Canada and then the US Federal Reserve (Fed) at their January meeting, opted to keep rates steady. The steady as she goes approach disappointed equity markets, which experienced a mild sell-off following the January Federal Open Market Committee (FOMC) meeting.
Fed Chair Jerome Powell noted in the press release following the meeting that the FOMC is “focused on our dual mandate to promote maximum employment and stable prices for the American people.” In other words, more of the same.
Some economists took comfort in Powell’s view that the economy has made good progress toward the dual mandate objectives. Noted Powell, “Inflation has eased from its highs without a significant increase in unemployment.” Good news with a but… “inflation is still too high, ongoing progress in bringing it down is not assured, and the path forward is uncertain.” Talk about a buzz kill!
On the plus side, this take on the economy is well within our 2024 outlook. We have assigned a reasonable probability that the Fed could opt for three 25 basis point rate cuts likely beginning in the summer months. The view that 2024 would witness a series of aggressive rate cuts (some economists have been forecasting up to seven rate cuts in 2024) was never in our wheelhouse. In fact, aggressive hikes might actually be a negative for the financial markets as it would imply a weaker than expected economy.
The concern among FOMC members is the robust US labor market which continues to surprise markets. In January, the U.S. economy added a whopping 353,000 jobs which significantly surpassed economists’ forecasts and because it cast a wide swath across all sectors, defied concerns of a slowdown.
The concern is that outsized wage demands could cause a wage price spiral. So far that has not been an issue as increased productivity has provided a counterweight to recent above trend wage settlements. In time we think the incoming data will support that position and allay some of the FOMC concerns.
YIELD SHARES
Remember when the reason for buying a mutual fund was to get diversification through a single security. Rather than buying 15 or 20 stocks in different industries – a strategy that was beyond most individual investors – one fund provided exposure to a specific asset class. Easy to buy and sell in dollar increments – rather than number of shares – with liquidity provided at the end of each trading day.
Next came exchange traded funds (ETFs) that allowed investors to buy and sell a portfolio of securities during normal trading hours. Today, most ETFs trade after hours and in some cases 24 hours a day.
With the latest ETF iteration, fund companies and Wall / Bay Street brokerages have brought the industry full circle offering non-diversified single stock ETFs to enhance performance and yield.
The first single stock ETFs were marketed as a way for small investors to gain access to high priced stocks at a reasonable price. For example, the Berkshire Hathaway class A shares trade on the NYSE at US $545,500 per share, well beyond the reach of individual investors. Another twist allows Canadian investors to buy single stock ETFs that hold high-profile US stock priced in Canadian dollars.
More recently investment companies have launched single stock ETFs which employ a covered call strategy. Purpose Investments for example, offers so-called Yield Shares on Apple, Alphabet, Tesla, Amazon, and Berkshire Hathaway.
According to Purpose Investments press release, Yield Shares are designed to offer investors a new tool to maximize yield in their portfolios. With Yield Shares, investors will earn enhanced monthly distribution yield through an investment in funds holding some of the world’s most widely held stocks, while maintaining exposure to the underlying stock’s performance.
The idea is to provide investors with an above average tax-advantaged income stream by writing (i.e. selling) covered calls on approximately 50% of the shares held by the ETF. The Yield Shares employ up to 25% leverage which presumably is in place to allow unitholders to participate in any potential upside experienced by the underlying security.
The Yield Shares dual strategy requires a deeper analysis that goes beyond the traditional marketing hype. To put some numbers on this strategy let’s assume you buy the Purpose AAPL Yield Shares which holds units of Apple Inc. Let’s assume the fund sells enough units to buy say, 1,000 shares of Apple and the manager employs 20% leverage using margin to purchase an additional 200 shares. The fund now holds 1,200 shares in total, at which point the manager presumably sells six covered calls which implies an obligation to sell 600 of the shares within the portfolio at the strike price of the call option.
Before we go further, allow me to provide some background on the covered call strategy. Investors who sell covered calls are obligated to deliver the underlying shares to the call buyer at a set price referred to as the options strike price.
For example, let’s say you were to buy 100 shares of Apple at US $182.50 per share (the price at the time of writing). For this example, we will sell one Apple March 185 call option at US $5.50 per share.
Some points of clarification: the sale of one call option contract represents an obligation to deliver 100 shares of the underlying security at US $185 per share. The call option in question is set to expire on March 15th. Since the investor owns 100 shares of the underlying stock, the call option is effectively “covered.”
By the March 15th expiration date, the investor will experience one of three possible outcomes. If the stock remains where it is (i.e. US$182.50), the call option will expire worthless. The individual who purchased the call option will not force the covered call writer to deliver shares at US $185 (the strike price of the option) when the option buyer can purchase the same shares in the open market at US $182.50.
If the stock rises above the US $185 strike price at expiration, the option will be exercised. The investor would be required to sell the 100 shares at the strike price of the call. Any potential price appreciation above the strike price would accrue to the call buyer.
That latter point, I suspect, is the logic underpinning the use of leverage as any profit on the shares held by the investor beyond what is obligated to be delivered to the call buyer would accrue to the fund’s holding in the excess shares.
Finally, the stock could decline. The advantage with covered call writing is that any decline in the shares will be offset somewhat by the premium received (US $5.50 per share in this example) which means the unlevered investor is in a better position than the investor who did not sell a covered call. That position is more tenuous when leverage is involved.
The premium received from the sale of the covered call is taxed as a capital gain in Canada which is why marketing departments emphasize yield enhancement. Purpose Investments, for example, believe that the yield on the APPL Yield Shares will be north of 7% annually, with the income being paid monthly.
Summary
The Purpose Yield Shares have a management expense ratio (MER) of 0.52%. That may seem reasonable for an actively managed ETF, but it probably understates the effective MER because the total fees collected by Purpose Investments are being calculated on the leveraged value of the fund. One must ask if the strategy is cost effective, when investors can execute the same strategy using the underlying shares.
Our other concern is the leverage which, by definition, is a two-edged sword. It provides some oomph to the strategy if the stock is rising but has an outsized negative impact on the strategy in a down market. That may be appropriate for an investor with a more aggressive risk profile. But as we said before, if leverage is appropriate, we could simply use margin to implement the same strategy directly in your account.
Finally, there is the issue of pricing the options being used in the strategy. The challenge is trying to ascertain a fair value for an option on a single security. Something that academics have long argued is not possible.
That’s because an options’ price requires one to input a volatility assumption. Think of volatility as a tool to measure the up and down movement or put another way, the risk associated with the underlying security. A single security is exposed to company specific risk (a risk that diversification across sectors seeks to mitigate) which is unknowable. Where one is working with an unknowable, there is no way to input a reasonable volatility assumption.
What the Purpose managers are attempting to do is manage single stock risk while employing leverage. That’s a tall order!
The conclusion: we prefer using a diversified portfolio when attempting to generate tax-advantaged income through the sale of covered calls. After all the goal is to generate above-average income not to seek upside returns that may or may not be generated by a single security.
Banking On Income
Portfolio management involves a delicate balance between investor’s emotions and portfolio objectives. This balancing act is critical when making significant life cycle decisions such as transitioning one’s portfolio from wealth accumulation to income generation.
When investors are motivated by wealth accumulation, success is measured by the growth rate of the portfolio over time. Evaluating an income mandate versus a growth portfolio is as different as chalk and cheese. With an income portfolio, the key determinant of success rests with how much income is being generated against how much income is required.
An income strategy requires the investor to shift their focus from growth to cashflow generation. An income portfolio seeks out assets with a history of generating consistent tax efficient income that ideally, grows over time. That’s very different from growth models where the beginning and end game is the monthly value of the portfolio. With an income mandate, growth takes a back seat to cashflow, which requires a marked change in the investor’s focus. That’s a tall order since most individuals spend the bulk of their life cycle focusing on the monthly performance of the portfolio, where little thought is given to the cashflow – if any – that is generated by the portfolio.
As investors transition into their retirement years, income becomes critical. The challenge managers face is helping investors alter their view on the success or failure of the portfolio. This is a challenge in a rising rate environment, like we have experienced since the first quarter of 2022 where interest rates have risen at an unprecedented pace.
One approach is to overweight sectors that can deploy levers to mitigate against a rise in rates. You look for companies that can maintain their payouts when rates are rising and ideally, without damaging the share value. That eliminates sectors such as REITs that tend to generate above-average payouts using leverage. Office, retail, and residential REITs provide examples of the risks commensurate with a rising rate environment. Most often these securities cut their payouts to preserve cash.
A better approach is to use financials in this type of environment. Banks, for example, have sufficient capital to maintain and increase their dividend payout. More importantly, higher rates can improve margins and profits unless, as happened over the past twenty-four months, we are confronted with an inverted yield curve.
When the yield curve is inverted loan margins are pinched because banks borrow short term (usually a year or less) and loan longer-term. Typically, loans are used to finance home purchases and new construction with terms ranging from three to seven years. When loan margins contract, profits decline and share prices fall. When income portfolios are holding an overweight position in Canadian banks, the value of the portfolio declines. These are positions that will recover over time, but the bigger challenge is managing the disconnect between the portfolio’s objective and the investor’s perception.
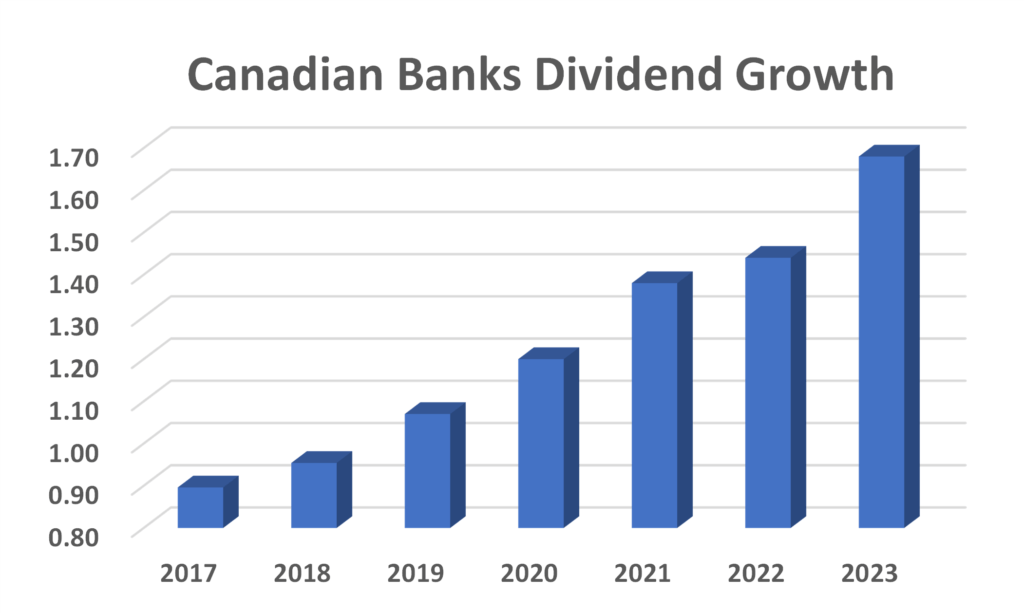
With that in mind, it is probably a good time to engage in a self-evaluation on how best to manage income for retirees. Recognizing that the portfolio’s objective is to provide reliable cashflow that ideally grows over time underpins the overweighting of Canadian banks. The chart to the right illustrates the growth in dividends paid out by Canadian banks since 2017.
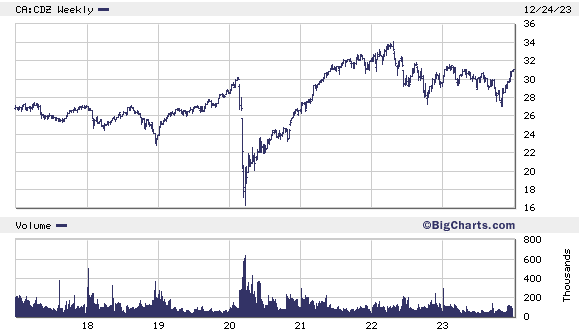
On the other side of the coin, we will look at the performance of the BMO Equal Weight Canadian Bank ETF (Listed TMX, Symbol ZEB). Note that ZEB is trading about the same price as it was pre-pandemic (see chart). If one were to view this as a stand-alone measure, then the ETF has underperformed the broader market which leads one to question its merits. But that conflicts with the objective of the income mandate because it ignores the growth in cashflow.
That’s why discipline is so important. While we have focused on the performance of Canadian banks the fact is, similar results can be found with all securities that have historically generated above average payouts. Most other companies with above average payouts have frozen their dividends or cut the payouts. Canadian banks have not, and in fact, have increase their payouts, despite the unusual economic backdrop.
Then there is the “to big to fail” understanding that takes bankruptcy off the table. We can’t think of a better argument for using these securities in an income mandate with a risk profile that is, by definition, conservative.
That’s not to suggest we don’t include other securities such as bonds to augment performance and reduce risk, but it does support our position that overweighting Canadian banks in an income mandate has value. It also lays a foundation for share value appreciation as the economy normalizes, which it will in the fullness of time.

Richard N Croft
Chief Investment Officer